Wouldn't it be great if creating infographics was as simple as writing regular ol' text-based blog posts? Unfortunately, the reality is that making visual content like this usually takes a lot more time, effort, and let's face it -- skill -- than the written word. Usually.
But considering the popularity and effectiveness of visual content in marketing today, you can't just afford to throw in the towel.
That's why we decided to take all the pain and suffering out of infographic creation. Seriously -- don't give up just yet. You, too, can create infographics that are totally free, professional-looking, high-quality, and completed in under an hour. I'm going to prove it. First things first:
Download our 15 free infographic templates here.
Then, all you have to do is provide the content to use inside them. Easy as that! In fact, I'm going to show you just how easy it is by taking one of our 15 infographic templates in PowerPoint (pictured above) and creating my own, customized infographic with it. Then, I'll explain exactly what I did so you get a sense of how easy it really is.
Would you rather watch this tutorial instead of read it? Check out the video below:
Click here to download your free infographic templates.
How to Create Infographics for Free in Under an Hour
Step 1: Collect Your Data/Content, and Choose Your Desired Template
Your first step is to collect the data/content you'll be using to populate your infographic, and choose an infographic template appropriate for representing that data. The important thing is to choose a template that specifically works for the type of data set/content you want to present. As you saw pictured above, you can download our 15 infographic templates in PowerPoint and choose whichever template you'd like. Some of your template options here include a timeline, flowchart, side-by-side comparison, and a data-driven infographic.
You can either collect third-party data or use your own original data. If you use third-party data, just be sure you properly cite your sources -- just like in any other good piece of content.
To keep your infographic uncluttered by a ton of different source URLs, a great way to cite your sources is to include a simple URL at the bottom of your infographic that links to a page on your site. It can also list the individual stats used in your infographic, and their sources -- such as the landing page to the full offer on which you're basing this free infographic.
That way, your infographic looks clean and professional, yet people will still be able to access the sources no matter where the infographic gets shared or embedded. It may also even drive visitors back to your site.
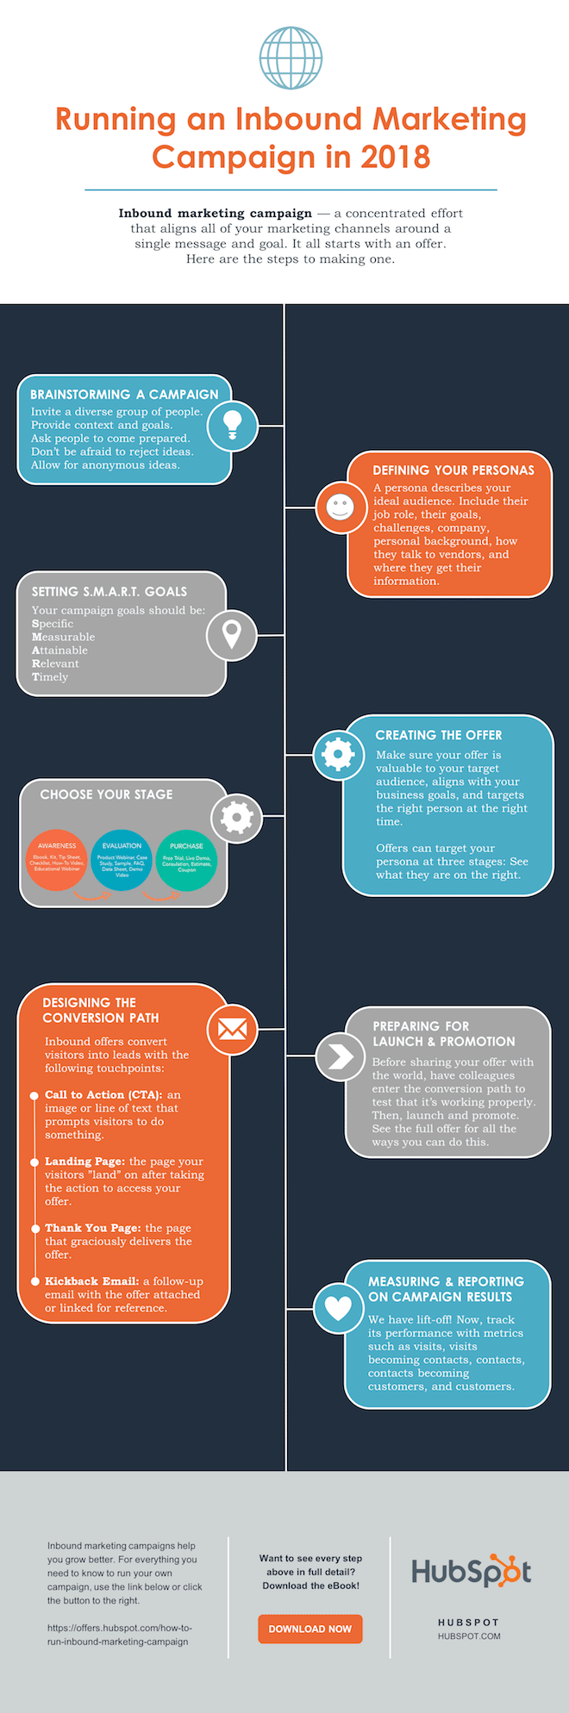
For the sake of time (remember, our mission is to create an infographic in under an hour), I'm going to create an infographic based on a compilation of steps and best practices we've put together in our new guide, How to Run an Inbound Marketing Campaign in 2018. For this, I'm going to pick the "World's Greatest Timeline" infographic template from our collection of infographic templates, which is helpful for my data set since it outlines each step of the campaign creation process in order.
This template is pictured below, and full of opportunities to customize:

Step 2: Customize Your Infographic
Obviously, this is the most time-consuming part -- but it's also the most fun! Simply come up with a catchy title, plug in your data/content, and adjust your font sizes and formatting. Feel free to switch up the graphics and colors, too, so they're relevant to your brand and the data you're providing. For other templates, you can use the simple graphs and charts provided by PowerPoint to create things like the bar graph or the pie chart. (Note: Download our free infographic templates for a cheat sheet for using PowerPoint's various features and tools.)
To customize the look of the infographic even more, you might add or change up the colors or font styles.
Finally, I included a link to my source (which can be found here), as well as the HubSpot logo so people know who created the infographic if it gets shared in social media or embedded on other websites -- which is definitely something you want, since one of the main benefits of creating infographics is their shareability.
That's it! This whole thing took me under an hour to put together -- much shorter than it would've taken me if I'd started from scratch (not to mention more professional looking ... and less expensive than hiring a designer). Here it is:

Share This Image On Your Site
<p><strong>Please include attribution to blog.hubspot.com with this graphic.</strong><br /><br /><a href='https://blog.hubspot.com/marketing/create-infographics-with-free-powerpoint-templates'><img src='https://blog.hubspot.com/hs-fs/hubfs/free-infographic-template-custom.png?t=1519083478566&width=1138&height=3428&name=free-infographic-template-custom.png' alt='free-infographic-template-custom' width='660' border='0' /></a></p>Step 3: Add an Embed Code and Pinterest Button, and Publish It
The only thing left to do is to publish and promote your awesome new infographic. As I mentioned earlier, we recommend using your blog to publish it (including your list of sources), including a Pinterest button for visitors to easily "pin" your infographic on Pinterest, and create and add an embed code for visitors to share it on their own websites and blogs, as we did above.

No comments:
Post a Comment